Chapter 1: Getting Started
What Bridger does, how it's organized, and what you see on the screen.
The Problem Bridger Solves
Data migrations are deceptively complex. A medium-sized conversion might involve dozens of source tables, hundreds of target columns, and thousands of individual mapping decisions. Each decision carries context: where the data comes from, how it transforms, who approved it, and what happens when the source value doesn't fit the target.
Teams generally reach for spreadsheets for this work. Spreadsheets are fine until the migration reaches a size where you spend more time managing the spreadsheet than planning the conversion. A purpose-built tool handles the organization so you can focus on the decisions.
Bridger replaces the spreadsheet with a purpose-built environment for planning and documenting data migrations. It tracks every mapping decision with status, transformation logic, and structured notations. It enforces consistency through shared configuration. It generates reports for stakeholders and validation scripts for developers. And it keeps everything in a single portable file that the whole team works from.
Bridger is a planning tool. It documents what should happen during a migration and tracks progress toward completion. The actual data movement happens in your ETL tools and conversion scripts. Bridger ensures everyone agrees on the plan before code gets written.
How Bridger Organizes a Migration
Bridger uses a layered structure to separate reusable definitions from project-specific work. Understanding these layers is the key to working efficiently.
Workbook
Everything lives in a single workbook file with a .bridger extension. The workbook contains your Configuration, your Library, and one or more Projects. It is self-contained—no database connections, no network dependencies. You can email it, check it into version control, or drop it on a USB drive. The file format is JSON, so it's human-readable in a pinch, but you'll rarely need to look at it outside of Bridger.
Configuration
Configuration defines the vocabulary and rules that all projects in the workbook share. This includes status codes that track mapping progress, notation types for structured documentation, logic templates for common transformation patterns, exception codes for error handling, common functions for reusable validation routines, auto-mapping rules for automated column matching, special source tables for non-column mapping targets, and report templates for stakeholder output.
Bridger ships with a set of defaults for all of these. You can start mapping immediately and adjust the configuration as your team's workflow takes shape. Every configuration element is fully customizable.
Library
The Library stores table and column definitions independently of any project. It has two sides: a Source Library for legacy system schemas and a Target Library for destination system schemas. Import your data dictionaries here once, then pull tables into projects as needed. When a schema changes, update the Library and sync the changes down to any projects that use those tables.
The Library is optional. You can import tables directly into a project without going through the Library first. But for any migration that spans multiple projects or expects schema evolution, the Library saves significant rework.
Project
A Project is where the actual mapping work happens. Each project has its own set of source tables, target tables, and the mappings between them. A workbook can hold multiple projects—one per functional area, one per migration phase, or however your team organizes the work. Projects are independent of each other but share the workbook's Configuration and can pull tables from the same Library.
Mapping
A Mapping is the documented relationship between a source endpoint and a target endpoint. The source endpoint is typically a column from a source table, but it can also be a Source Group (multiple columns contributing to one target) or a special source table (for exclusions, defaults, and stored values). The target endpoint is a single target column.
Each mapping carries a status, transformation logic, and zero or more notations. The status tracks where the mapping is in your review workflow. The transformation logic describes how the source data becomes the target data. Notations provide additional context—business rules, edge cases, historical decisions, test cases.
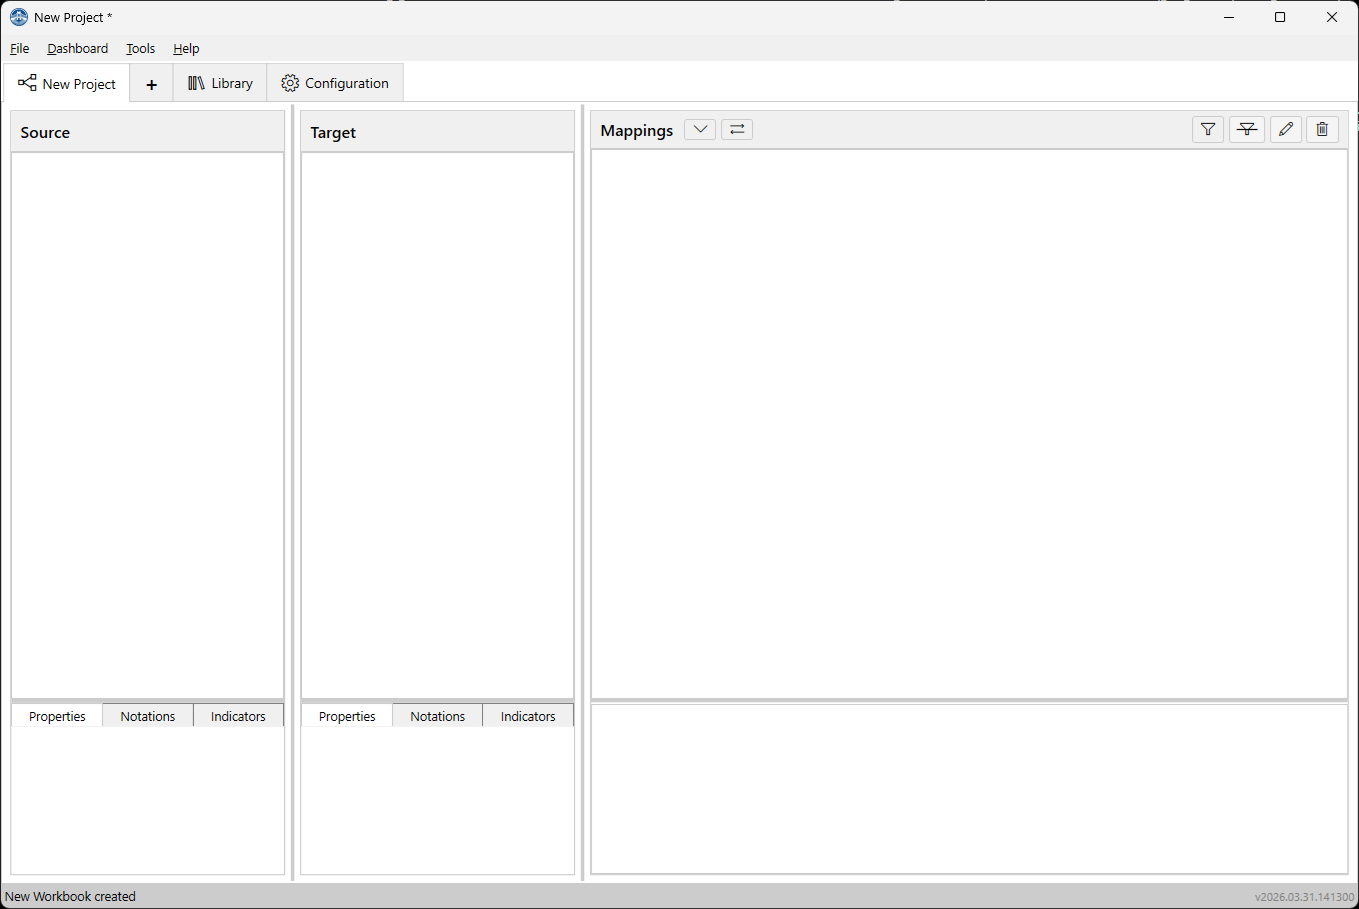
The Workspace
When you open a workbook and select a project tab, the workspace is organized into dedicated panels. Hover over the image below to see a description of each one.
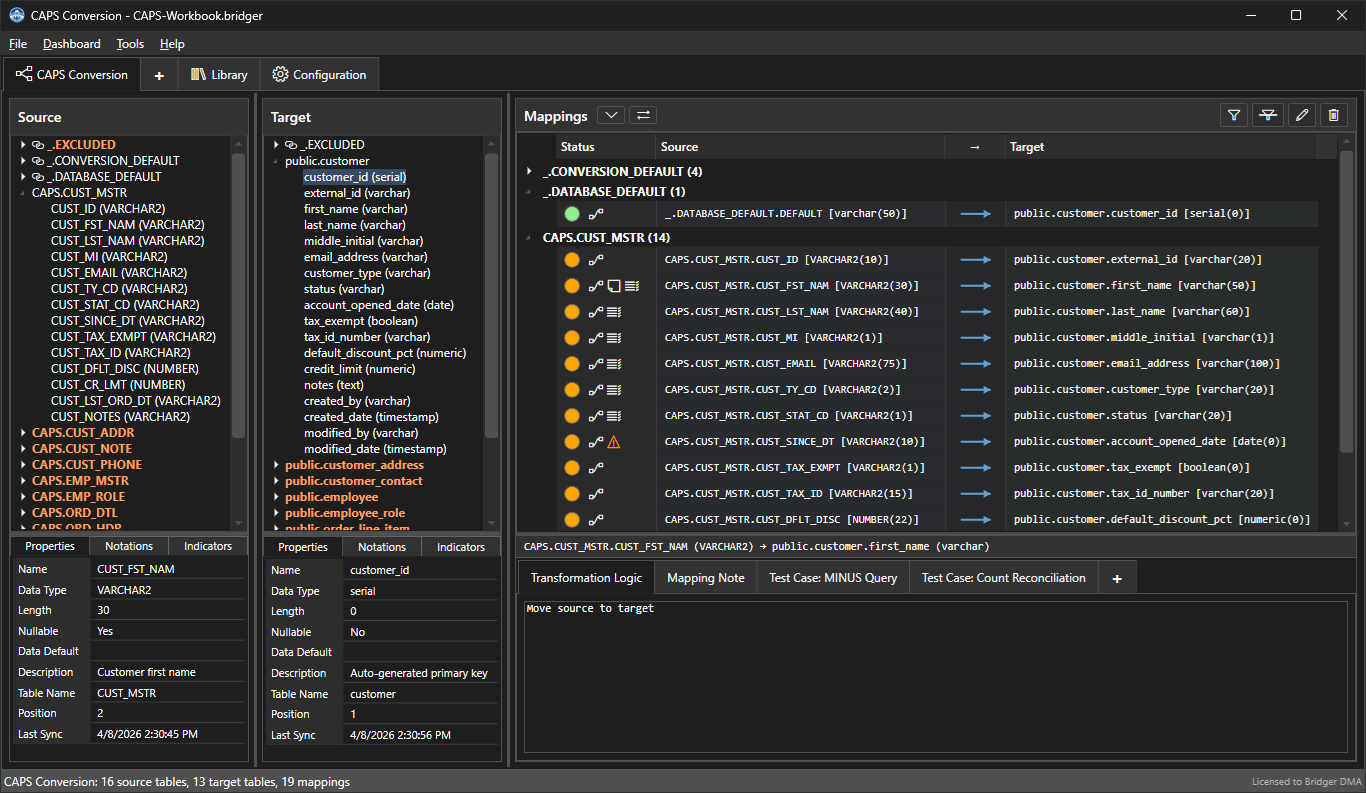
Source Panel

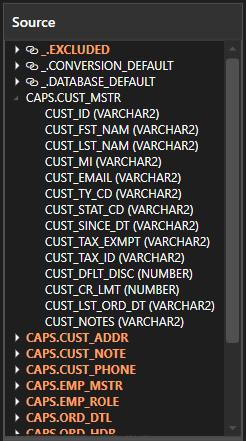
The left side of the workspace shows your source tables and their columns in a tree view. Tables are listed in the order you've arranged them (you can reorder by dragging). Expand a table to see its columns. Select a table or column to see its properties and additional information in the properties pane below. This is where you drag from when creating mappings.
Target Panel

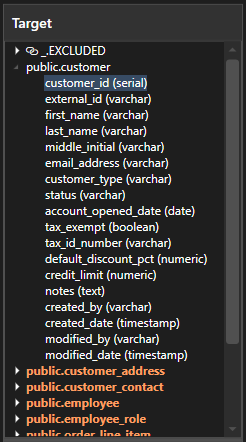
Next is the target panel. It is similar to the source panel but shows your target tables and columns. This is where you drop when creating mappings. The same expand/collapse and reordering controls apply.
Mappings Panel

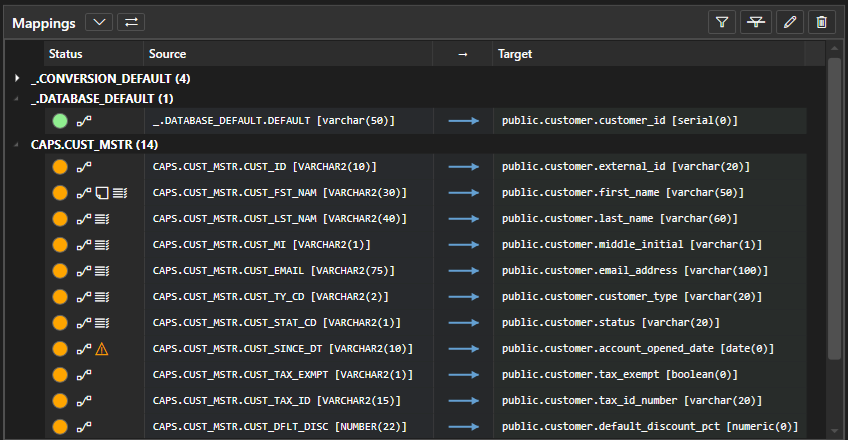
The third area shows all mappings in the current project, grouped by table. Each row shows the source column, a connector, the target column, and the current status. Selecting a mapping displays its details in the mapping detail pane below. The mappings panel supports a view toggle that switches between Source → Target grouping (organized by source table) and Target ← Source grouping (organized by target table), letting you work from whichever perspective fits your current task.
Properties and Mapping Detail Panes

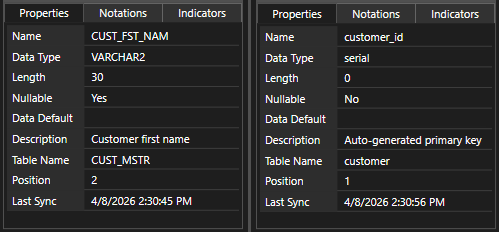
Below the main panels, the properties panes show detailed information about the table or column selected above—schema details, indicator values, and any table-level or column-level notations.

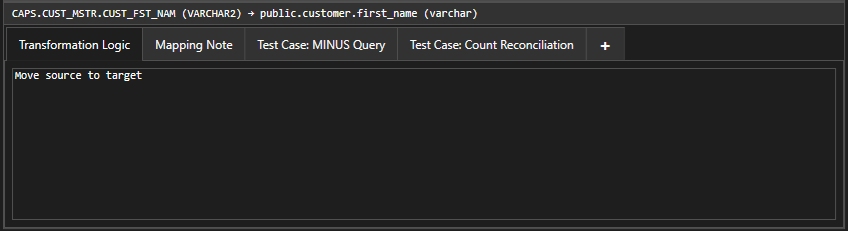
The mapping detail pane shows the same kind of information for the selected mapping: its status, the source and target columns, and all attached notations organized by type in a tabbed interface.
The Tab Bar


Along the top of the workspace, a tab bar provides access to everything in the workbook.
Project Tabs
Each project appears as a named tab. Click a tab to switch to that project's workspace. Right-click a tab to access project operations: Rename, Duplicate, Properties (name, description, and project-level settings), or Delete.
The [+] Tab
At the end of the project tabs is a [+] button. Click it to create a new project. Bridger assigns a default name that you'll want to change immediately—"New Project" isn't going to help anyone six months from now.
Library Tab
The Library tab switches to the Library workspace, which has its own source and target panels for managing your reusable table definitions. The Library workspace looks similar to the project workspace but focuses on schema management rather than mapping.
Configuration Tab
The Configuration tab opens a panel with editors for all the shared configuration elements: status codes, notation types, indicators, logic templates, exception codes, common functions, auto-mapping rules, special tables, and report templates. Changes here affect all projects in the workbook.
The Menu Bar
The menu bar provides access to file operations, tools, reports, and help.
File Menu
| Item | What It Does |
|---|---|
| New Workbook | Creates a new workbook with default configuration. Prompts to save if there are unsaved changes. |
| Open Workbook | Opens an existing .bridger file. |
| Open Recent | Quick access to recently opened workbooks. |
| Save / Save As | Saves the current workbook. Save As writes to a new filename. |
| Import → | Submenu: Import Workbook (merge another .bridger file), Import Components (selective import of configuration elements), Import from Excel (reconstruct a project from a mapping spreadsheet). Covered in Chapter 6 and Chapter 10. |
| Export → | Submenu: Export to Excel generates a report from the current project using a selected report template. Covered in Chapter 6. |
| Exit | Closes Bridger. Prompts to save if there are unsaved changes. |
Dashboard Menu
Lists your configured report templates for quick preview access. Select a template and Bridger opens a preview of the current project's data in that format without navigating through File → Export.
Tools Menu
| Item | What It Does |
|---|---|
| Settings | Opens the Settings dialog for theme selection, quality indicators toggle, and AI features toggle. |
| Validate Workbook | Runs the full validation pipeline against the current workbook and reports any issues found. Covered in Chapter 5. |
| Compare Workbook | Compares the current workbook against another .bridger file and produces a formatted difference report. Covered in Chapter 9. |
AI Menu
Visible when AI features are enabled in Settings. Provides access to Ollama configuration, connection testing, modelfile generation, and model deployment. Covered in Chapter 11.
Help Menu
Displays the Welcome orientation dialog, opens this user guide, and shows version information (About).
View Controls
Source ↔ Target Toggle
The mappings panel can display your work from two perspectives. The default Source → Target view groups mappings by source table—useful when you're working through the legacy system asking "where does this data go?" Click the toggle to switch to Target ← Source view, which groups by target table—useful when you're reviewing the destination schema asking "where does this data come from?" The toggle is a button in the mappings panel toolbar.
Zoom
The entire interface scales smoothly. Use Ctrl++ to zoom in, Ctrl+- to zoom out, and Ctrl+0 to reset to the default size. This is a global setting—it affects all panels, trees, and text.
Theme
Bridger supports light and dark themes. Switch between them in Settings under the Tools menu. Dark mode adjusts all UI elements for reduced eye strain during extended work sessions. Theme changes take effect after restarting the application.
Keyboard Shortcuts
| Shortcut | Action |
|---|---|
| Ctrl+N | New workbook |
| Ctrl+O | Open workbook |
| Ctrl+S | Save workbook |
| Ctrl+E | Export to Excel |
| Ctrl++ | Zoom in |
| Ctrl+- | Zoom out |
| Ctrl+0 | Reset zoom |
| Ctrl+Click | Toggle selection of individual items |
| Shift+Click | Select a range of items |
| Double-click | Edit mapping or jump to associated columns |
File Basics
The .bridger File
A workbook is stored as a single .bridger file. The format is JSON, which means it's plain text, version-control friendly, and recoverable in an emergency with any text editor. In normal use you'll never interact with the JSON directly.
Window Title
The window title bar shows three pieces of information: the active project name, the workbook filename, and a dirty indicator (an asterisk) when there are unsaved changes. This gives you constant awareness of which file you're working in and whether you need to save.
File Association
Bridger registers the .bridger file extension during installation. Double-clicking a .bridger file in Windows Explorer opens it directly in Bridger. You can also pass a filename as a command-line argument.
Auto-Recovery
If Bridger encounters an issue during startup or detects potential problems with a workbook on load, it runs an automatic repair pass. The results of any repairs are displayed in a summary dialog so you know exactly what was adjusted. This includes things like orphaned column references, missing indicator definitions, and database field inconsistencies.
Welcome Tip
On first launch, Bridger displays a Welcome tip dialog with a brief orientation. You can revisit this at any time from the Help menu. The built-in user guide (the document you're reading now) is also accessible from the Help menu.
What's Next
You now have the lay of the land—what Bridger is for, how it organizes migration work, and what the workspace looks like. In Chapter 2: Building Your First Map, you'll import tables, create your first mapping, and work through the basic workflow from start to finish.